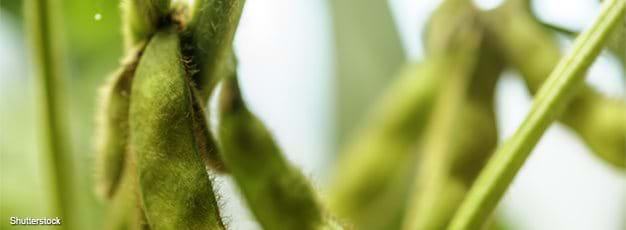
Soybeans are the fourth leading crop produced globally, by volume. While some of the crop is used directly, more than 85 percent is further processed through crushing into soybean meal and oil. Soybean meal is typically used as an animal feed for its protein content. Soybean oil is mostly used for food consumption and, more recently, for other uses such as biodiesel. Combined, soybeans and their derivatives are the most traded agricultural commodity, accounting for over 10 percent of the total value of global agricultural trade. Global trade in soybeans and soybean products has risen rapidly since the early 1990s and, in 2008/09, surpassed global trade of wheat and total coarse grains. According to USDA Agricultural Projections to 2025, world trade is projected to increase in soybeans by 22 percent, in soybean meal by 20 percent, and in soybean oil by 30 percent.
The primary factors driving global soybean and products trade include population and income growth, which are driving the world’s increasing demand for livestock products, as well as policies implemented by major agricultural importers and exporters. These include domestic and border policies that apply to soybeans and products or livestock products.
Policy shifts could affect global trade of the soybean complex. The USDA Agricultural Projections to 2025 reflect the effects of trade agreements, sanitary and phytosanitary restrictions, and domestic policies in place or authorized by November 2015 (see box “What Is the USDA Baseline?”).
Demand for Feed Grows as Incomes and Meat Consumption Expand
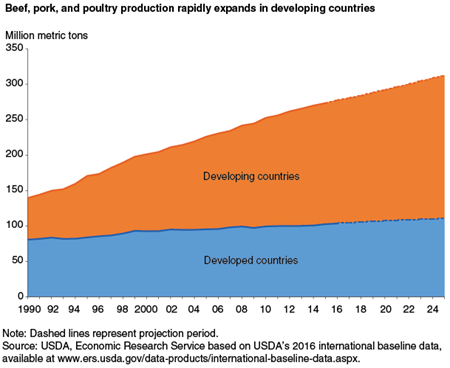
As populations, income levels, and urbanization expand worldwide, diets are shifting from staples to more diversified products, including meat and other high-value agricultural products. This trend is projected to continue to boost demand for feed grains and protein meals, particularly from soybeans, for livestock production and vegetable oils for food. The swift expansion of poultry production and consumption in developing countries is a major driver behind the growing demand for feed and protein meals.
Soybean Trade
Soybean exports depend on the demand and policies of importers. The United States and Brazil account for over 80 percent of global soybean exports. Much of this trade is influenced by the policies of importers, including China, many Asian countries, and the European Union (EU). Brazil, the world’s largest soybean exporter, is projected to increase shipments between 2016/17 and 2025/26 by 35 percent to 76.4 million tons. Soybean exports from the next largest exporter, the United States, are expected to grow 6 percent to reach 52.4 million tons in the same time period.
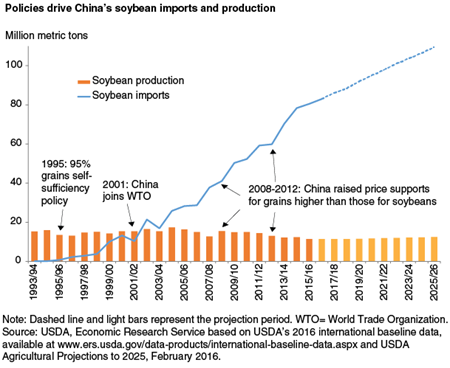
China’s domestic and trade policies lead soybean import demand. China’s dominance of the soybean import market stems from its grain self-sufficiency and soybean border policies, coupled with its consumers’ rising incomes and changing diets. In 1995, the Government of China adopted a policy of 95 percent self-sufficiency for grains, centering many of its policies toward this goal. Many governments may develop commodity support programs to provide income to farmers and influence their production decisions by altering their relative economic incentives. For example, from 2008 to 2012, China increased price supports for wheat (45 percent), rice (88 percent), and corn (54 percent) at higher rates than those for soybeans (41 percent), which put soybean production at a disadvantage. China’s domestic soybean production dropped 18 percent over the period, while imports jumped 50 percent.
In addition to higher supports for grain production, China’s border policies favor soybean imports. Import tariffs for soybeans (3 percent) are lower than those for soybean meal and oil (5 percent and 9 percent, respectively). This encouraged the quick emergence of China’s oilseed crushing industry to become the largest in the world, leading to greater gains in soybean imports than in soybean meal and oil imports. As China’s policies favoring grain production remain and its feed and livestock industries develop further, the countrie’s high soybean demand is projected to continue. Although China’s soybean import growth rate will be slower than it was 10 years ago, it is projected to remain strong in absolute terms over the next decade by increasing from 83 million tons in 2016/17 to 109.5 million tons in 2025/26. Its global soybean import market share is projected to expand from 63 to 68 percent over the same period.
Asia and EU policies influence soybean imports. Other major soybean importers in Asia, including Japan, Korea, and Taiwan, support their oilseed crushing industries by maintaining higher tariffs on soybean oil imports. The region’s soybean imports have been trending downward partly because of declining populations and a continual shift from importing feedstuffs for livestock production to importing meat and other livestock products. Over the next 10 years, Japan’s annual soybean imports are expected to decline from 2.8 million to 2.5 million tons.
Environmental regulations affecting the hog industry in markets such as the EU, Taiwan, and Korea also limited the growth of their livestock and feed industries, affecting their soybean imports. Soybean imports of the EU, Taiwan, and Korea’s are expected to remain steady over the projection period at 13.7 million tons, 2.4 million tons, and 1.4 million tons, respectively.
Soybean Meal Trade
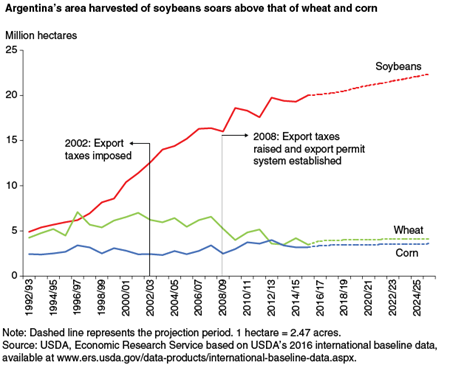
Argentina’s export policies lead global soybean meal and oil trade. Some countries, such as Argentina, impose taxes on agricultural exports as a means to generate revenue for the government. Taxes, however, create additional costs to producers and market participants and can influence production and marketing decisions. Varying export tax rates for competing commodities create incentives for producers to produce or market more of the commodity with a lower tax rate.
From 2002 to 2015, Argentina applied taxes on its agricultural exports and an export permit system that limited the quantity of exports of certain key agricultural products. Argentina’s export taxes are lower for soybean meal and oil relative to soybeans, providing relative economic incentives to export more of the country’s soybean products. This stimulated the construction of large oilseed crushing facilities and, consequently, more soybean meal and oil exports. In 2008, the Government raised export taxes on major agricultural exports and required export permits, essentially limiting export quantities for other major agricultural products such as corn, wheat, and beef. By contrast, soybeans and their derivatives face fewer obstacles to sell abroad (after deducting export taxes), and there were abundant opportunities to expand soybean area through double cropping and adjusting crop-pasture rotations on marginal lands in the northwest part of the country. Thus, Argentina’s soybean area rapidly expanded and is projected to reach over 22 million hectares by 2025/26 (1 hectare = 2.47 acres). The area harvested for wheat declined starting in 2002, while the area harvested for corn remained steady with slight increases over time and soybeans continually increased.
Argentina’s differential export tax system and export permit system on agricultural products led to its dominance of the soybean meal and oil export markets. The country is projected to capture over half of the world export market for both products over the next decade. Argentina’s soybean meal exports are projected to increase more than 30 percent from 2016/17 to nearly 41 million tons by 2025/26. Over the same period, its annual soybean oil exports are projected to expand 49 percent to 7.8 million tons. This growth may be tempered by a higher use of soybean oil to produce biodiesel.
The projections do not reflect potential effects of new policies implemented more recently in Argentina, including removing export taxes on wheat and corn and reducing export taxes on soybeans, meal, and oil; eliminating its export permit system; and lifting its currency controls. These policy changes are likely to affect the domestic agricultural sector as well as global agricultural markets. Without the added cost of export taxes, Argentina’s corn and wheat farmers could generate more income. Planting decisions may be affected by this change as farmers may choose to plant crops based on market prices rather than policies such as export taxes or permits. Further, lifting the currency controls recently devalued the Argentine peso, which will encourage farmers to sell crops that they previously held in storage while waiting for better prices before selling them. All of these factors could change Argentina’s dominance as a major soybean meal and oil exporter if it shifts to other agricultural products.
Brazil and U.S. Soybean Meal Exports
Brazil’s soaring poultry and pork production boosts domestic soybean meal consumption and limits increases in soybean meal exports. The country’s annual exports of soybean meal are projected to increase by 4.6 million tons (31 percent) over the decade, much less than the nearly 20-million-ton increase in its soybean exports. Brazil’s soybean-crushing capacity is expected to expand at a slower rate due to strong competition from Argentina in the international soybean meal market. As a result, Brazil’s share of world soybean meal exports remains in the 22- to 24-percent range over the period.
U.S. soybean meal exports are projected to increase slightly to 10.7 million tons by 2025/26. The U.S. share of world soybean meal exports is expected to decline from 16 percent in 2016/17 to slightly more than 13 percent by 2025/26. The competitiveness of U.S. exports may continue to be disadvantaged by a comparatively high value of the dollar.
EU policies drive soybean meal imports. The EU is currently the world’s largest soybean meal importer because its limited domestic soybean production levels cannot supply its large domestic livestock and feed industry. While rapeseed is the major oilseed produced in the EU, livestock nutritional considerations limit rapeseed meal use in feed rations, thus leading to the EU’s demand for soybean meal imports. Soybean meal remains the most efficient and cost-effective protein for feed rations in poultry and swine production feed. EU production of rapeseed oil biodiesel increased after individual member states began producing biofuels in the 1990s and the EU’s Biofuels Directive took effect in 2003. The Directive established voluntary targets for biofuels to account for a growing share of the EU’s transportation fuels. Although EU soybean meal imports are projected to remain high over the next decade, imports slightly contract from 20.2 million tons in 2016/17 to 19.4 million tons in 2025/26 as the region’s livestock production shrinks.
Domestic soybean meal production from EU soybean imports has declined as processing margins decreased from low demand for soybean oil. Edible soybean oil consumption in the EU has been discouraged by food-labeling requirements, which require packaged foods to specify whether ingredients were produced from genetically modified (GM) crops. The EU’s biotechnology policies and slow approval process for the use of GM soy products delays U.S. soybean and soybean meal exports into the market.
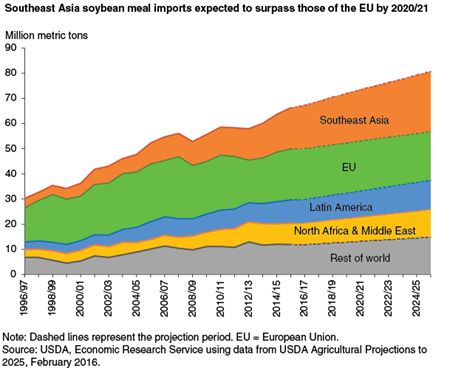
Southeast Asia and other regions to rapidly expand soybean meal imports. Rapid growth of soybean meal demand by Southeast Asia is driven by its rising incomes, changing diets, and flourishing poultry and pork sectors. Many countries in the region are unable to meet their protein feed demands because of limited land available for soybean production and limited soybean crushing capacity. As a result, many countries in Southeast Asia implemented favorable trade measures to support soybean meal imports at very low or no import tariffs, which currently range from 0 to 8 percent. Southeast Asia’s soybean meal imports are projected to climb rapidly over the next 10 years, increasing 6.7 million tons by 2025/26, and account for nearly 50 percent of the projected increase in world soybean meal trade. By 2020/21, the region is expected to surpass the EU as the top market for soybean meal imports, with Indonesia and Vietnam leading the region.
Annual soybean meal imports by countries in North Africa and the Middle East are projected to rise by 2.4 million tons by 2025/26, accounting for 18 percent of the increase in world trade in the period. Russia’s policies designed to expand its livestock industry are driving its soybean meal imports, which are expected to grow more than 70 percent from 0.4 million tons to 0.7 million tons in the same period.
Soybean Oil Trade
United States and Brazil soybean oil exports. The United States and Brazil are the world’s second- and third-largest soybean oil exporters, respectively. Much of their exports depend on demand from and policies of importing countries and regions. U.S. soybean oil exports are projected to rise steadily over the next decade and reach 1.4 million tons per year in 2025/26. The U.S. is expected to account for slightly more than 10 percent of global soybean oil trade in 2016/17 but gradually lose market share as domestic use for biodiesel production expands. U.S. imports of canola oil from Canada and palm oil from Southeast Asia are projected to continue to grow strongly, augmenting U.S. edible oil supplies for domestic consumption.
Brazil’s annual soybean oil exports are projected to slightly increase from 1.1 million to 1.3 million tons over the coming decade, as the country is expected to use more soybean oil for biodiesel production. The expansion of soybean production into new areas of cultivation is expected to enable the country to increase soybean oil exports gradually.
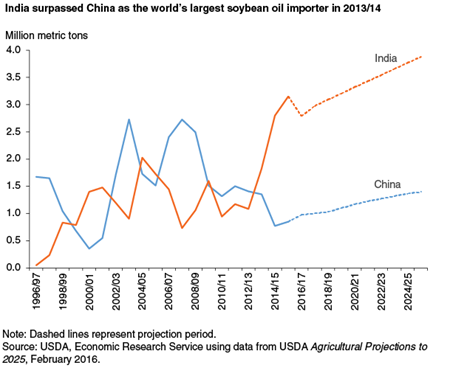
Policies in India and China affect soybean oil imports. Although palm oil accounts for a large share of India’s vegetable oil imports, India surpassed China in 2013/14 to become the world’s leading importer of soybean oil. China’s soybean oil imports declined as its crushing industry developed. China’s annual soybean oil imports are projected to rise slowly from 1.0 to 1.4 million tons over the next decade.
India’s soybean oil imports are expected to continuously rise over the next 10 years by as much as 39 percent to reach 3.9 million tons by 2025/26. India’s large population, rising incomes, and limited area for expanding oilseed production contribute to its climbing imports. With low oilseed yields, due in part to periodic excessive monsoon rainfall and low input use, India is unable to produce enough oilseeds to meet its domestic vegetable oil demand. Despite its history of high import tariffs for vegetable oils—40 percent for soybean oil and as high as 85 percent for other oils—India has been a major vegetable oil importer. In response to high food prices in 2008, India slashed its soybean oil tariffs, further contributing to the projected rise in imports.
The North Africa and Middle East region is projected to remain the largest soybean oil importing region, followed by Latin America. Income and population growth will contribute to gains in oil demand and imports of these regions, with imports growing 25 percent over the next decade to reach 5.7 million tons by 2025/26.
What Is the USDA Baseline?
USDA's long-term agricultural baseline projections are a departmental consensus on a 10-year scenario for the agricultural sector. The baseline analysis is conducted annually and finalized in November of the prior year to be published in February of the following year.
Projections cover production and consumption for agricultural commodities, global agricultural trade and U.S. imports and exports, commodity prices, and aggregate indicators of the sector, such as farm income and retail food prices.
The baseline scenario is not a USDA forecast of the future but, instead, a conditional scenario about what would be expected to happen under a continuation of current farm legislation, average—or normal—weather in each year, and specific assumptions about external conditions. Projections are also based on critical long-term assumptions for U.S. and international macroeconomic conditions, U.S. and foreign agricultural and trade policies, and growth rates of agricultural productivity in the United States and abroad.
Provisions of current law are assumed to remain in effect throughout the baseline projection period. The projections assume that there are no shocks that would affect global agricultural supply and demand.
The projections provide a neutral reference scenario that can serve as a point of departure for discussion of alternative farm-sector outcomes that could result under different domestic or international assumptions. The projections are made by interagency committees in USDA and reflect a composite of model results and judgment-based analyses. ERS has a central role in preparing the projections.
-
The GLOBALG.A.P. Database
April 06 2023 -

Why food crisis will explode?
May 24 2022 -
-
-
Supply Chain 2.0:Digitizing Bananas
May 04 2022